Skip to content

Senior Software Engineer, Frontend & Product

Engineering the experience.

Sophisticated interfaces. Thoughtful architecture.

Building intuitive applications and the systems behind them, from initial concept through production.

Fig. 01 — Modular grid
Composition stage

Single units, each with one responsibility.

From elements to experiences.

Small, deliberate decisions become sophisticated interfaces.

Step through how a handful of primitives become components, and how those components become a working interface. Every stage is live — use it.

Fig. 02 — Composition
Transformation stage

The smallest decisions: color, type, space, line, state and motion.

  • ColorFive colors: Parchment, Jet Black, Dark Slate, Deep Eucalyptus, Terracotta.
  • TypeThree typefaces: Instrument Serif, Lato and IBM Plex Mono.
  • SpaceA spacing scale built on a four-pixel unit.
  • LineHairline rules and small, consistent corner radii.
  • StateInteraction states: rest, hover and focus.
  • MotionShared easing curves and durations.

One dataset. Many perspectives.

The same information can tell different stories.

Explore patterns, trends and distributions through three representations of one year of sample activity. Choose a view and a range, then select any day, week or weekday to read it closely.

Fig. 03 — Developer activity, 2025Illustrative sample data — not real activity
View
Date range
Contributions
2,719
Active days
316of 365
Daily average
7.4
Busiest day
63Tue, Oct 28

Each square is one day, shaded by contributions on one fixed scale for every range.

Arrow keys move the selection; Home and End jump to the start and end. Details follow the chart.

Less
  • 0
  • 1–3
  • 4–8
  • 9–12
  • 13+
MoreSelected
Data table — calendar, Full year 2025
Behind the visualization

Data & transformations

One seeded year of sample data; every number on screen comes from pure, tested functions over it.

More detail: Data & transformations
  • 365 days of illustrative sample data from a small seeded generator — a weekday rhythm, two busy periods, two quiet ones, four one-day spikes. The same seed always yields the same values; it is not anyone's real activity.
  • Aggregations: a range slice, Monday–Sunday weeks (edge weeks are marked partial, never padded), calendar months, and weekday averages — each weekday's total divided by how many of that weekday the range contains, so uneven counts compare fairly.
  • Calendar shades split at the quartiles of the year's non-zero days (1–3, 4–8, 9–12, 13+) and stay fixed for every range, so a day never changes shade when you filter.
  • Unit tests check that every view, and the four quarters, add up to the same totals.

Rendering & performance

Plain HTML and CSS marks — no chart library, SVG or canvas — and aggregation that runs once per range.

More detail: Rendering & performance
  • With at most 365 marks, each one can be a real, labelled button. CSS grid and percentage heights handle every screen size without measuring.
  • Aggregations are memoized per range, so moving the selection or the pointer never recomputes them.
  • Hover uses one delegated listener that updates only when the pointer reaches a different mark; the 365 calendar cells don't re-render as it moves.

Interaction & accessibility

One shared selection across all three views, each a keyboard radio group with a data-table twin.

More detail: Interaction & accessibility
  • The selection is a single day. The calendar moves it by day or week, the timeline by week (keeping the weekday), the distribution by weekday (keeping the week).
  • Changing the range keeps the selection when it still applies; otherwise it moves to that range's busiest day, and the change is announced.
  • Each view has one tab stop: arrow keys move the selection, Home and End jump to the edges, and Previous / Next do the same for pointer and touch.
  • Values are never color-only: every mark has a text label, the selection is outlined and named, and the data table holds every value shown.

Ideas, brought to life.

Different problems. Different solutions. Thoughtful design and engineering throughout.

Fig. 04 — Selected work

Plate 01 — GitVis
GitVis: perspective
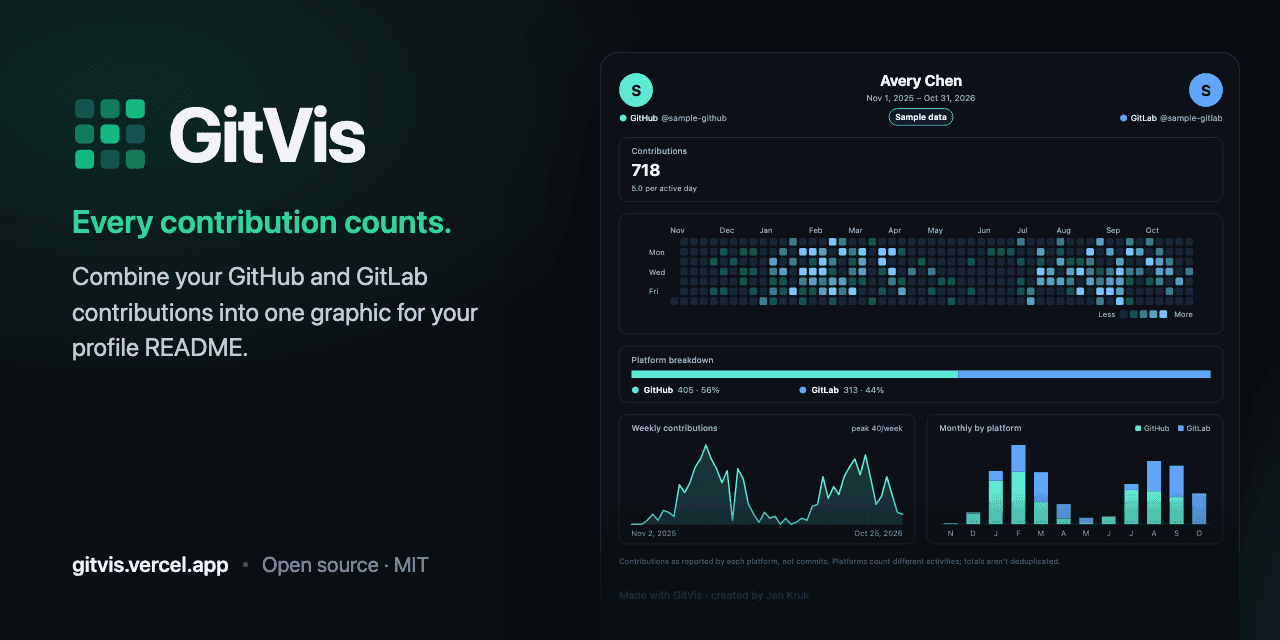
GitVis preview: the GitVis wordmark and the tagline “Every contribution counts.” beside a dark dashboard card for a sample profile — 718 contributions, a contribution heatmap, a GitHub and GitLab breakdown bar, a weekly trend line and monthly bars. The card is labelled “Sample data”.
A dashboard card, rendered from sample data.

01 / 04

GitVis

One contribution graph for GitHub and GitLab.

For developers whose work is split across GitHub and GitLab, GitVis combines both into a single activity card they can design and embed in their profile README — no sign-in, public data only.

Role
Product, design and engineering.
The engineering challenge
Treat an image URL in someone's README as a public API: it has to keep rendering the same card for years, stay fast, and survive upstream rate limits.
Engineering notes: GitVis

Approach

  1. Every design choice lives in a versioned query string. Golden-URL tests and byte-identical SVG snapshots keep existing embeds from ever changing.
  2. Cards are server-rendered SVG through a small, dependency-free serializer, tested for byte-for-byte parity with React's own renderer.
  3. Upstream data is cached in 12-hour windows; when a platform is unavailable, the last good copy is served — labelled with its date — for up to seven days.

Also in the build

  • Days a platform doesn't report stay unknown rather than zero, so each total matches the platform's own profile.
  • GitHub history arrives in one GraphQL request with a block per year; GitLab's public calendar is read without a token.
  • 24 palettes in light and dark; custom colors are corrected to at least 3:1 contrast. Exports as SVG or PNG, with Markdown and <picture> snippets.
  • Playwright end-to-end tests — including axe accessibility checks — run against a production build and a fake upstream.

Technologies

  • Next.js
  • React
  • TypeScript
  • SVG
  • GitHub GraphQL
  • GitLab REST
  • Vitest
  • Playwright

Beyond the interface.

Thoughtful products rest on more than what you see.

Architecture, services, data and delivery — the engineering beneath an experience matters as much as the interface itself. Choose a layer to see where that work has happened.

Figure 5: a cross-section of an application — frontend systems, APIs and services, and data and persistence beneath the surface, with delivery and reliability alongside every layer. Choose a layer to read verified examples of that work.

Rendering, component architecture, state and accessibility — everything people touch.

  • React (used alongside your selection)
  • Next.js (used alongside your selection)
  • TanStack Start
  • TypeScript (used alongside your selection)
  • Canvas & SVG
  • MapLibre
  • React Query (used alongside your selection)

Server routes, integrations, identity and the asynchronous work that happens out of sight.

Modeling, storing, caching and keeping state consistent — and only as long as it's needed.

  • PostgreSQL (used alongside your selection)
  • Drizzle
  • SQL migrations
  • Caching (used alongside your selection)
  • Browser storage

Testing, continuous integration, deployment and monitoring — what keeps every layer trustworthy.

  • Vitest
  • Jest
  • Playwright
  • GitHub Actions
  • Vercel (used alongside your selection)
  • Error tracking & alerts (used alongside your selection)
  • Dependency security

In practice

APIs & services

Choose a technology above to see every story that uses it.
  1. The Fairy Archive · Order processing after checkout.

    Fulfillment that survives a closed tab

    People pay and close the tab; the order still has to be delivered, and the email sent, exactly once.

    • Webhooks
    • Stripe
    • Server routes
    • PostgreSQL
    • Vercel
    • Error tracking & alerts
    Explore The Fairy Archive
    How it was built: Fulfillment that survives a closed tab

    A verified payment webhook is the single trigger that hands each order to the video-rendering pipeline. Completion arrives as a signature-checked notification, backed up by status polling and a scheduled reconciliation job — and an alert goes out if those notifications stop.

  2. AtWords · Live head-to-head matches.

    The server keeps score

    In a competitive game, the client can't be the source of truth.

    • Server routes
    • PostgreSQL
    • Authentication
    Explore AtWords
    How it was built: The server keeps score

    Guesses are scored on the server, which also enforces turn order. Matchmaking claims a waiting player with a conditional update so two requests can't take the same opponent, and an internal-token check was hardened to fail closed with a timing-safe comparison.

  3. GitVis · Card and data endpoints backed by GitHub and GitLab.

    Protecting a shared upstream budget

    One popular card mustn't exhaust the shared token or cache a failure.

    • GraphQL & REST
    • Rate limiting
    • Server routes
    Explore GitVis
    How it was built: Protecting a shared upstream budget

    GitHub history comes from one GraphQL request per profile with a server-only token; GitLab's public calendar needs none. Each route has its own rate limit plus a shared upstream budget, and upstream limits map to typed errors that render as clear error cards — never cached.

Good work starts with good questions.

I enjoy the space where thoughtful design meets practical engineering—working through complex problems, finding the simpler path, and making products feel effortless to use.

I value curiosity, collaboration, and people who care about what they're building. The best work, in my experience, comes from sharing ideas, challenging assumptions, and paying attention to the details.

AvailabilityI'm open to the right next opportunity—particularly with teams building useful products and taking care with how they're made.

Have something in mind?

I'd love to hear about it.

Write to me at contactkruk@gmail.com